11
October
Exporting countries: the TOP15 in terms of sales figures
Growth in overall sales figures driven more by price increases than by higher volumes.
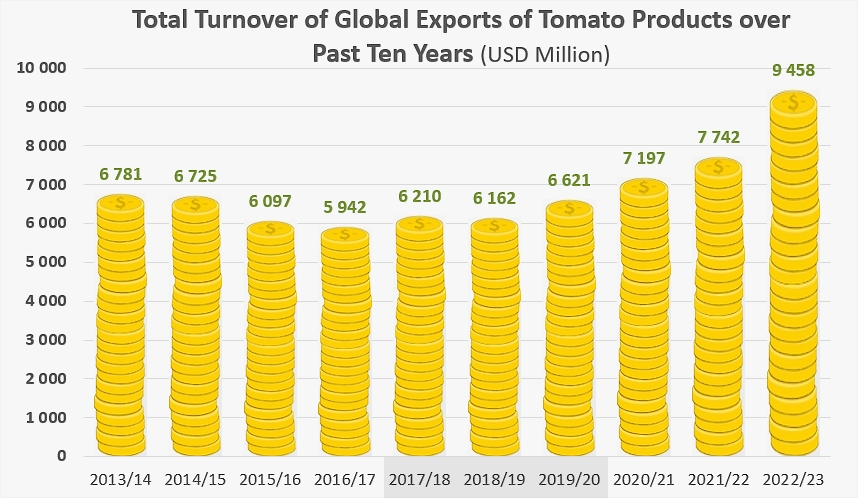
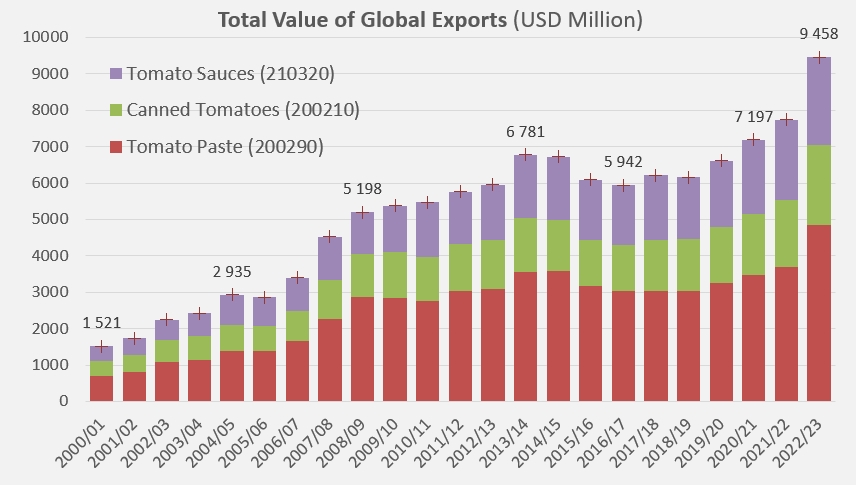
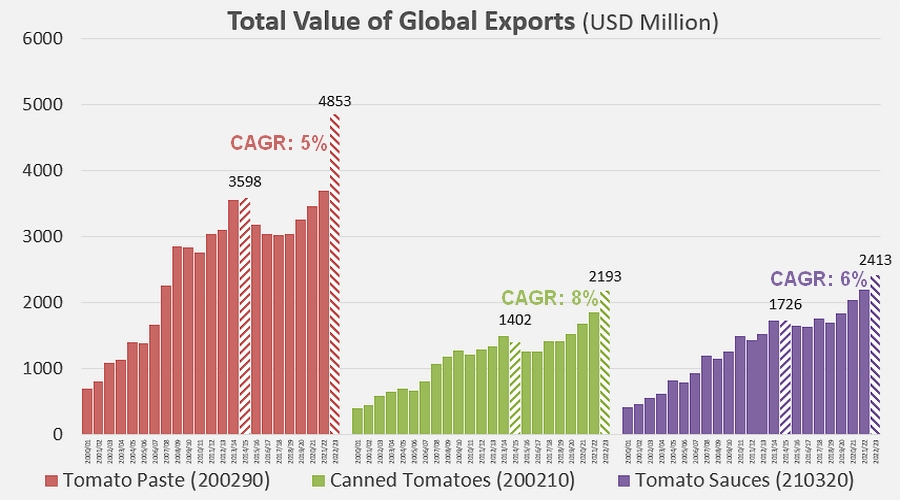
The total value of processed tomato products exported between July 2022 and June 2023 reached USD 9.46 billion, according to customs statistics provided by the 110 reporting countries. This value sets a new all-time record, up by USD 1.7 billion (22%) on the previous year, but also up by USD 3.1 billion (49%) on the average value (USD 6.3 billion) of exports in the pre-Covid pandemic period (2017/2018-2019/2020).
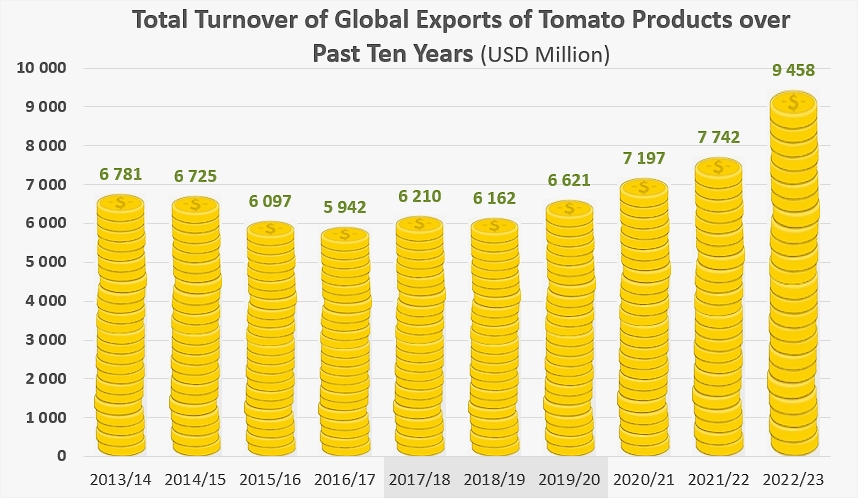
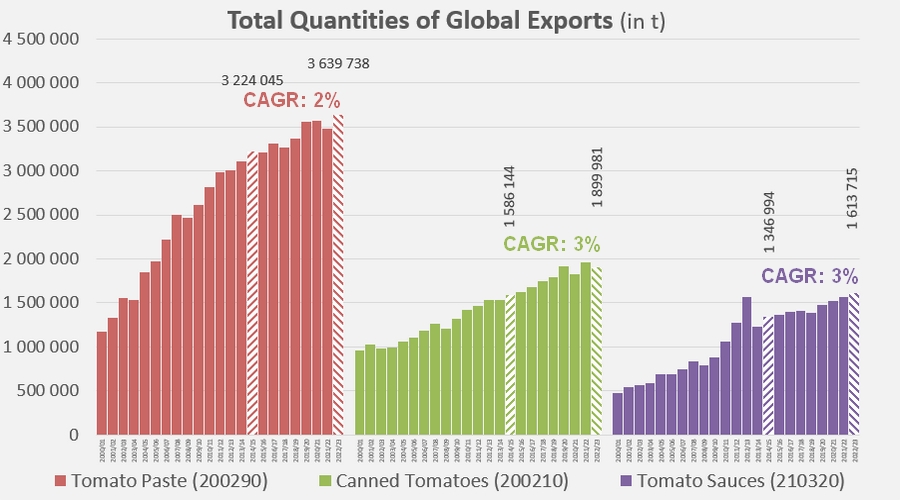
Over the last eight marketing years, i.e. since the 2014/2015 year that marked the start of a period of sluggish growth in the paste trade, the quantities of tomato products absorbed by foreign supply shipments have grown at an annual rate (CAGR) of between 2% and 3%, depending on the sector. At the same time, the total value of products traded has increased at an annual rate of close to 6%, with growth rates by category ranging from 5 to 8% (see appendices at the end of this article).
Over the same period, foreign sales of pastes accounted for around half the overall value of trade in tomato products, with exports of canned tomatoes and sauces generating 23% and 28% respectively.
These two categories enjoyed the fastest annual growth rates (CAGR) in value (7.7% and 5.7% respectively), while the value of exported pastes grew at an annual rate of 5.1%.
The main national industries supplying products and driving growth of worldwide exports, in terms of both quantity and value, have been Italy, China, Spain, the USA, Turkey, etc.
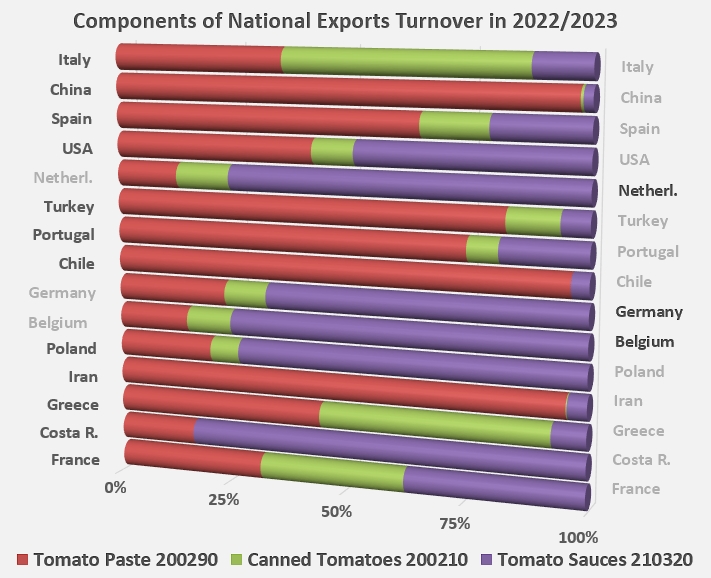
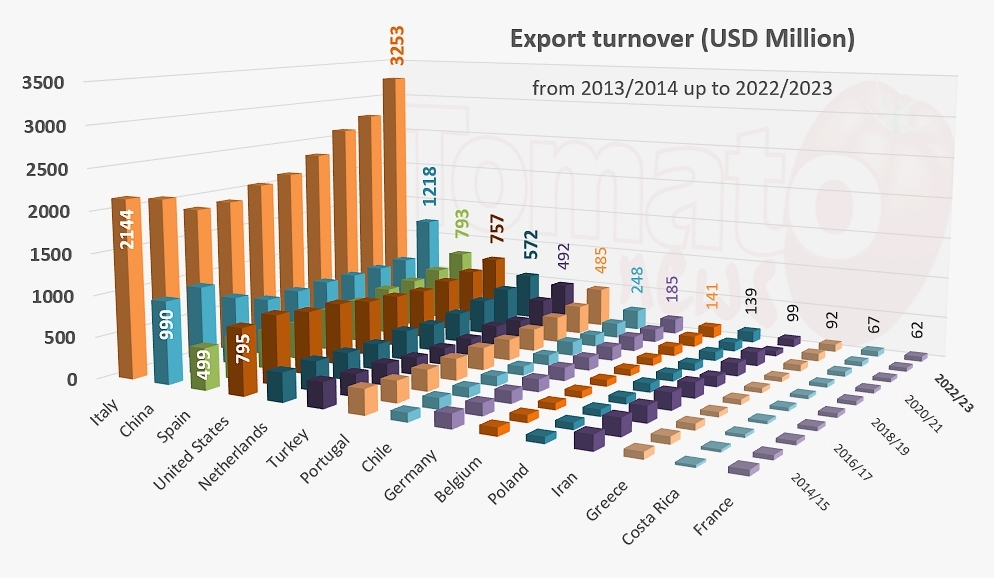
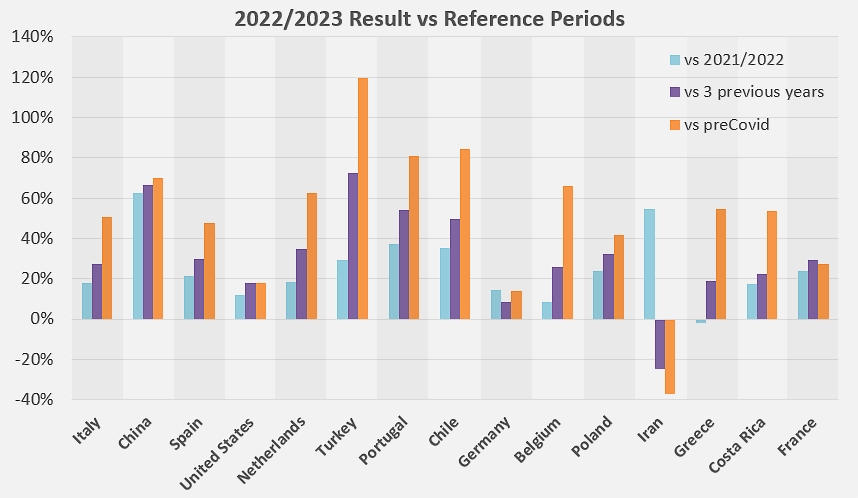
Thanks to the wide range of products it offers and its dominant position in the canned tomatoes category, Italian foreign trade generated sales of around USD 3.25 billion last year, up 18% on the 2021/2022 marketing year. Chinese earnings, essentially based on paste exports, came to around USD 1.22 billion, up 63% on the previous year.
No other national industry has exceeded the billion-dollar threshold. Spanish and US exports were virtually on a par, with the total value of products exported close to USD 800 million for the former (+21% year-on-year) and 760 million for the latter (+12%).
Two industries approached the USD 500 million threshold, with 492 million for Turkish exports, up 29% on 2021/2022, and 486 million for Portuguese exports (+37%).
Chilean sales were just under USD 250 million, 36% higher than the previous year.
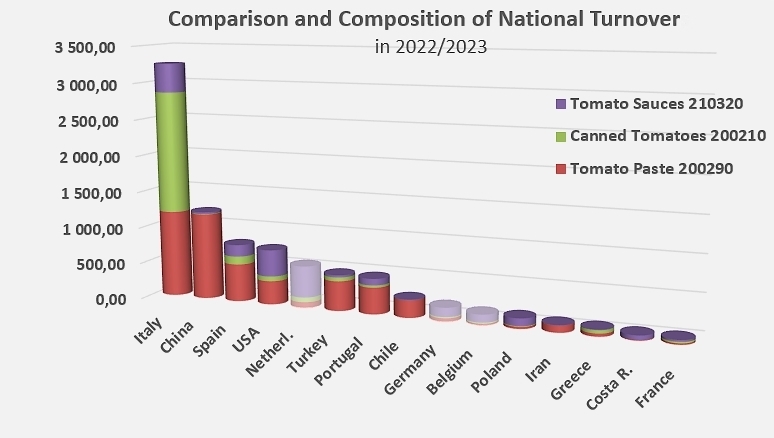
Three countries that are not active in the primary processing stage nonetheless ranked in the TOP10 for foreign sales of tomato products in 2022/2023 : their turnovers, stemming in all three cases mostly from tomato sauces & ketchup exports, place the Netherlands in 5th position in the worldwide ranking of tomato product exporters, with sales of USD 572 million in 2022/2023, up 19% on the previous year, while Germany and Belgium, ranked 9th and 10th respectively, exported products worth USD 185 million and USD 140 million.
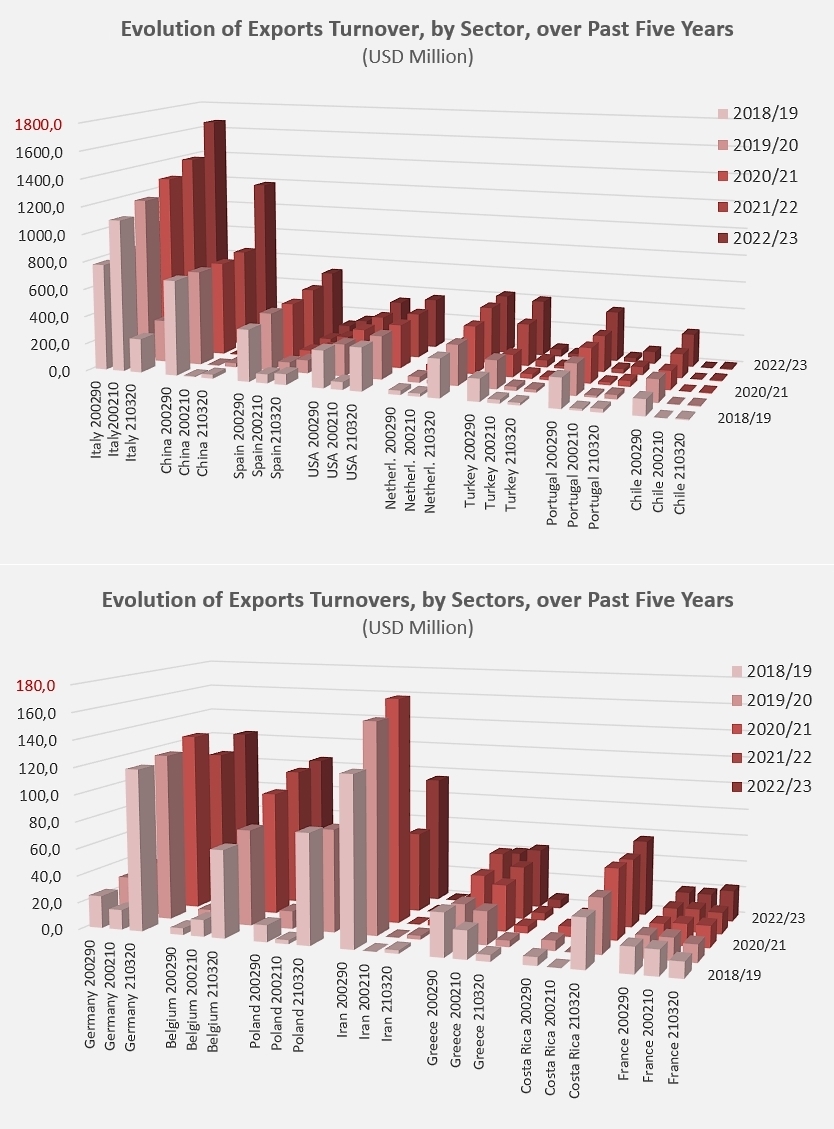
Tomato sauces and ketchup also account for the bulk of the Polish industry's USD 139 million in foreign sales. Conversely, the value of Iranian exports, close to USD 100 million last year, depended almost exclusively (96%) on foreign sales of tomato paste.
Lastly, the bulk of Greek export earnings was generated by exports of pastes and canned tomatoes, in virtually equal proportions, amounting to almost USD 92 million.
Some complementary data
Evolution of financial turnover and relative importance of the world's top fifteen export industries over the last ten years.
Progression of 2022/2023 turnover compared with the usual reference periods (previous year 2021/2022, average of previous three years, average of pre-Covid years) for each of the fifteen industries presented.
Changes in the value of world exports for each category, and average annual growth rate over the last eight years.
Changes in export volumes for each category, and average annual growth rate over the last eight years.
Changes in export sales figures by category for the fifteen national industries presented.
Sources: Trade Data Monitor
